Wet, Wet, Wet

To catch our non-brisbane based colleagues up on how wet it is in Brisbane at the moment, I thought I’d share some charts from BOM. 

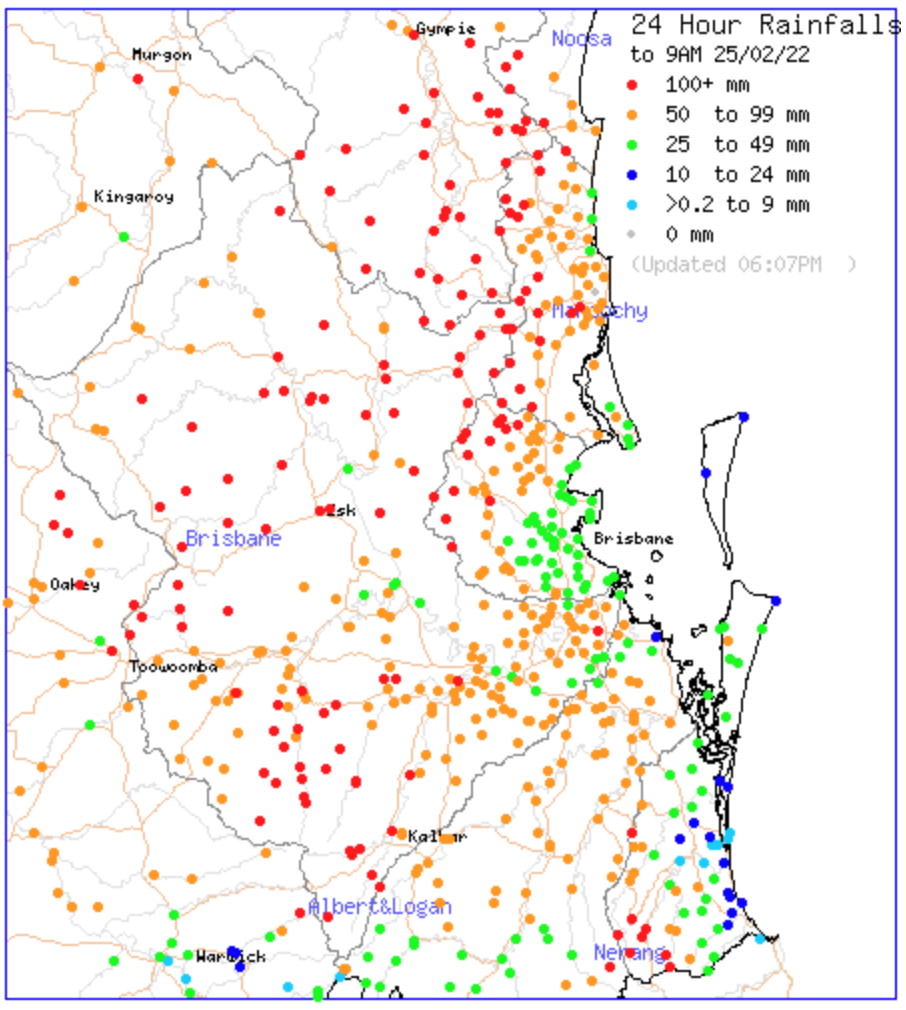
Top is 24 hour falls to 9am on Friday, the second is 24hour falls to 8am Saturday, the third is 24 hours to 9am Sunday. The upshoot of this is “it was wet, but it got a whole lot wetter and then stayed (really wet)”

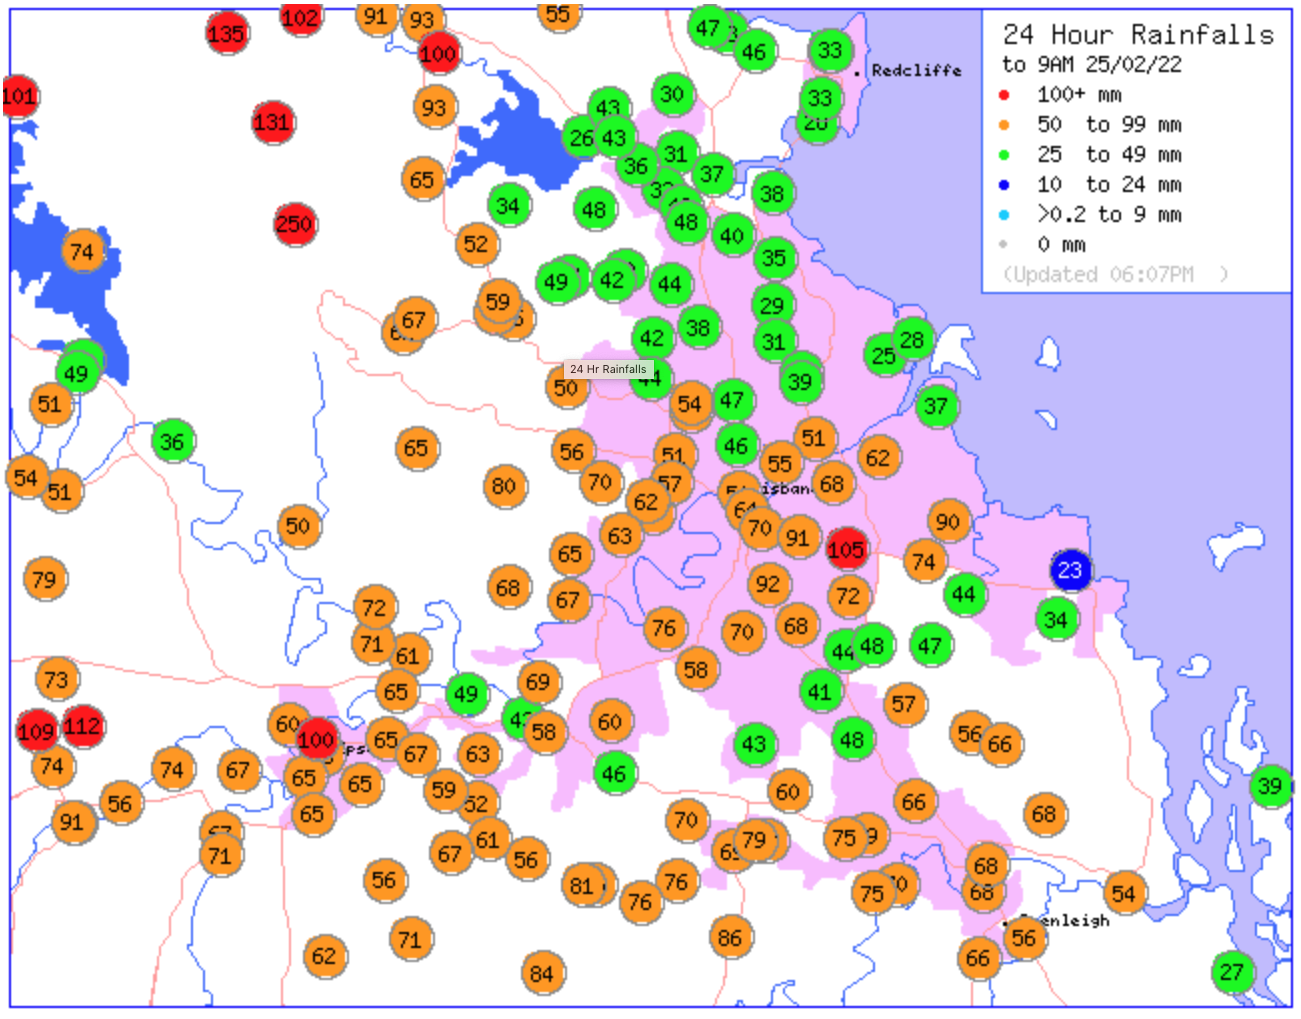
And here this doesn’t even give a full picture of HOW wet it is as the scale of this map tops out at 100+mm per 24 hours. Most of Brisbane is currently 2.5 times that amount and some parts of the sunshine coast have gotten over 350mm in 24 hours.

UPDATE: Mt Glorious in Northern Brisbane actually got 718mm in 24 hours. Note the average monthly rainfall for Brisbane is around 100mm.

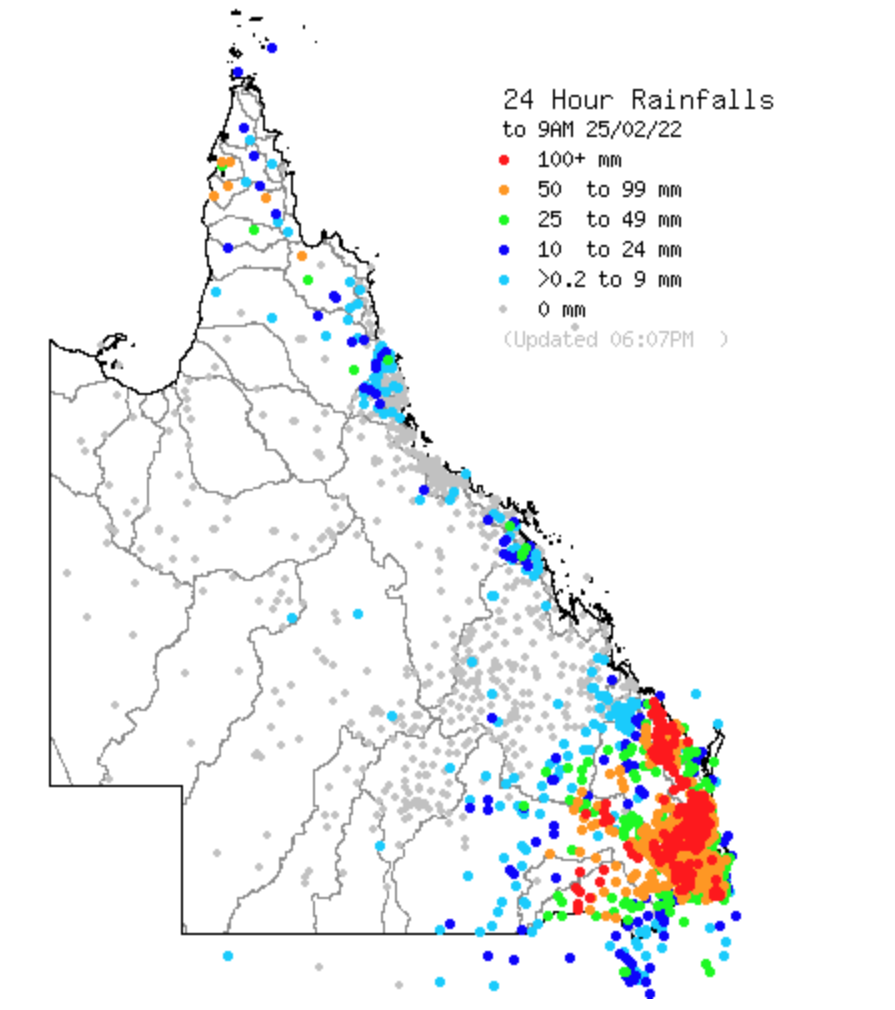
I am in the lucky place where I can think about this more abstractly than my neighbours who are busy grabbing sandbags to stop overland water from getting into their lower levels, so I thought this is also a good opportunity to really appreciate the incredible work done by the Bureau of Meteorology to provide such rich data presented in such a clear fashion.  The rainfall data can be viewed from the region all the way up to a national level – allowing a clear picture of the impacts of this weather system to be seen and understood.

Quick and Dirty Building Footprints

So someone at work today shared this post about the new visualisation released today by City of Melbourne for their digital twin project.

https://www.developmentactivity.melbourne.vic.gov.au/

The linkedIn post lists about 8 people who had a hand in crafting that page, but I wanted to see what I could put together in an evening. So I settled in and was able to put together the key components of the visualisation working and to get a live demo deployed on my new firebase website in about 2 hours.

So I was pretty pleased with all of that, but there are obviously some differences between their polished product and my slap-dash one. In the below image we can see that there are significant differences in the level of detail for the background (present day) buildings. I’ve sourced this data from the mapbox streets layer and it doesn’t seem to have the same detail as the CoM map. There are also some differences in the actual dataset itself. I’ve kept their colouring system (blue-applied for permit, green-approved permit, yellow-under construction) but with a more pastel flavour (as I am wont to do). Their data is showing some buildings as “under construction” which are only marked as “approved” in the data set I downloaded from the portal. There is also a blue building which isn’t in the data set I have at all. I’m guessing that they are probably working with a live copy of that data while I’m only able to get the publicly released cut which looks to be a bit out of date.

Overall though, it was a fun little project to recreate this and try out some cool features of Mapbox at the same time.

Setting up a “Home Page” using Firebase

I’ve never really been a person who has a large web presence but I was looking through domain names the other day and came across jamiecook.dev for a shockingly good price and finally went ahead and setup my own homepage (just calling it a homepage makes me sound old).

One of my work colleagues has been extolling the virtues of the Google Compute Cloud for app development for a while now and while I’m quite comfortable navigating Amazon’s AWS offerings I’ve never dipped a toe into the GCP before. But it comes with $300 free credit and certain things are “always free” – although not if you want to serve content to Australia – so I thought why not.

I purchased the domain through Google Domains to minimise friction through the process and was pretty impressed. There is quite a difference in the approach the two platforms take, Google’s has a decidedly more “consumer-y” feel to it than the wall of options that is AWS. Unfortunately, when it came to linking the firebase hosting application that I setup with the domain I purchased, there was no special sauce for making them talk to each other – I had to establish ownership using A records just like if I’d purchased it from GoDaddy. Twenty four hours later, however, everything was up and running over https and the little identity site that I downloaded from HTML5 UP was quickly available.

Next up will be to find something that can handle a bit more content actually put up more of the side projects that I’m working on.

Delaunay Flows in flowmap.gl

Screenshot 2019-04-11 22.47.15

Flow Map

My colleague Pedro Camargo has been generating something he calls Delaunay Lines for quite a while now using QGIS. So when I saw the recently updated deck.gl layers from Teralytics for generating flow maps using react components… I thought I should try and take Delaunay Flows off the desktop and onto the Web!!!

Screenshot 2019-04-11 22.48.29

Delaunay Flow Map

This is my first attempt at doing anything even remotely react-y, so it’s been a bit of a huge learning curve for me. But eventually I got something slapped together that demonstrates the concept. In the images above, we can see the original flowmap.gl visualisation of population movements in Switzerland alongside the simplified Delaunay flows. As can be seen the overall movement patterns are still evident, however there is significantly less visual clutter and no crossing lines, the total number of edges has reduced from 676 to 224.

Performance wise, this is a very small network, but even with the tessellation, path building and assignment stages happening inside the render loop, my little MBP is still able to keep the frame rate at 60fps, so I feel the implementation is probably okay enough for now.

My next steps are to:

  • move the main computation outside the main render loop and only calculate when the underlying network changes.
  • handle multi-level zoom
  • tidy up the code
  • create a PR back to flowmap.gl

Plotting Optus Cable Speed

So, I’m not exactly excited at my future life as a HFC NBN subscriber but I figure it has to better than what I have now right?

For a while now I’ve been storing speedtest results on a regular basis (about every 5 minutes) which allows me to do interesting visualisations of my home internet speeds.

The below image should (if I’ve done it correctly) be a constantly updating plot of my last 3 (ish) days of life as an Optus cable subscriber in a heavily oversubscribed neighbourhood.

optus_cable_speed

This is done by running a regular task on my synology NAS box which regularly uses the command line version of speedtest.net to get a timestamped up/down speed in to a csv file.

I am running this via a tmux session which is automatically started when the box boots up (don’t ask me why the synology doesn’t have a regular cron command), I then wrap the following little script in a permanent loop.

while true; do python plot_optus_speed.py; sleep 3600; done


import pandas as pd
import numpy as np
import plotly.plotly as py
import plotly.graph_objs as go
import scipy
from scipy import signal
N = 1000
df = pd.read_csv('/home/jamie/bin/speedtest-log.txt', header=None)
x=df[0][-N:].map(str) + " " + df[1][-N:].map(str)
download=df[2][-N:]
upload=df[3][-N:]
trace_down = go.Scatter(x=x, y=download, name='download speed', visible='legendonly')
trace_down_ = go.Scatter(x=x, y=signal.savgol_filter(download, 53, 3), name='download speed (smoothed)')
trace_up = go.Scatter(x=x, y=upload, name='upload speed', visible='legendonly')
trace_up_ = go.Scatter(x=x, y=signal.savgol_filter(upload, 53, 3), name='upload speed (smoothed)')
data = [trace_down_, trace_up_, trace_down, trace_up]
py.iplot(data, filename='optus_cable_speed')

Run in with an angry man

So I just had a great ride home that I had to share.

It started when I was filtering up the side of traffic stopped at lights, the lights turned green and I started off at the head of the lights. The guy in the bright blue sedan who was previously at the head, did not like this and proceeded to overtake me on the other side of the intersection with minimal clearance while yelling a mouthful of abuse out the window #classy

I then proceeded to ride home normally only to run into the same car parked at the right turning lights to Sir Fred Schonell Rd (about a km down the road). This guy then leans out the window and continues to yell abuse at me for breaking all sorts of road rules, with ominous “it’s your life you’re playing with”. He then proceeds to race off around the corner onto Sir Fred, and I think, that’s the last I’ll see of him.

But no, not content with that tirade he must have seen me in his mirror at one of the many lights along sir fred and thought I know what’ll make this interaction better.. a photo. So lo and behold as I am riding past the netball courts at UQ (a full 3.3km from where I first encountered this bozo) I see the same car circling back in the opposite direction to me, window down, phone extended out the window waiting for a happy snap. I of course obliged and gave him a thumbs up.

But I wonder at the thought process of this guy that he has taken the time to essentially stalk me along my ride home.

If anyone was wondering why cyclists don’t feel safe on our roads, this is a great illustrative example.

Building GSL on windows (sigh)

So I wanted to do some numerical computing in ruby (who needs SciPy anyways) so the best advice out there seemed to be to install the GNU scientific libraries (GSL – http://www.gnu.org/software/gsl/) and then get the comprehensive ruby bindings for it (http://rb-gsl.rubyforge.org/). Sounds easy enough right? Not really… here is how I did it (maybe, I haven’t finished yet)

1) Install the FULL MinGW (Minimalist GNU for Windows) – I was able to use the automated installer http://www.mingw.org/wiki/InstallationHOWTOforMinGW
2) Run MSYS.bat (for me this was C:\MinGW\msys\1.0\msys.bat)
3) mount c:/MinGW /mingw
4) mount c:/gsl /gsl
5) cd /gsl/gsl-1.16
6) ./configure
7) make
8) make a cup of tea… and wait

Cursor keys in vim

So I’ve been meaning to post more often for a while so to get myself back in the blogging mindset here is what I’m experimenting with today. I’ve been doing a lot more work in vim lately thanks to some encouragement from @nkpart and one of things I find myself still doing a lot is using the cursor keys to navigate, especially when I’m in edit mode… but not anymore thanks to this little gem from https://chris-lamb.co.uk/posts/kicking-vim-cursor-key-habit

" Unbind the cursor keys in insert, normal and visual modes.
for prefix in ['i', 'n', 'v']
   for key in ['', '', '', '']
     exe prefix . "noremap " . key . " "
   endfor
endfor

Calculating end-of-week (friday) from a date in postgresql

So I want to have, for any given date, the date of the corresponding friday in that week (for a timesheeting application)

To do this I use the following postgres trickery:

Select day + ((12-extract(dow from day)::int) % 7) as "Week ending"

Lets break that down.

Select day + an_offset as "Week ending"

What we are doing is taking the date and adding an offset to take us to the following friday (end of week) date. To calculate that offset we first extract the day of the week (dow) number of the date, this is a number representing the day of the week (1 – Monday, 2 – Tuesday, etc)

extract(dow from day)::int

We then subtract this number from 12 (following on from the numbering above, 12 is Friday next week)

(12-extract(dow from day)::int)

We then calculate a modulus with 7 to make sure that we only shift upto 6 days into the future.

(12-extract(dow from day)::int) % 7

The first time I implemented this I used

(5-extract(dow from day)::int) % 7

But this results in a negative number for Saturday and Sunday, meaning that for Saturday the date of the next Friday will be given as the day before. By using next friday (12) as our reference we avoid the negative number problem.

Using vim to edit crontab on Mac OS/X

Was trying to edit my crontab after making some changes to my .bashrc file and came across this strange error while saving

crontab: temp file must be edited in place

You can solve this in one of two ways
1) Use vi as your editor (EDITOR=vi crontab -e)
2) Set some special flags set in your vimrc to allow crontab editing to work properly

In your bashrc or where ever you store your aliases (I use a separate .aliases/commands config file that I source from .bashrc)

alias crontab=”VIM_CRONTAB=true EDITOR=vim crontab”

and then in your .vimrc


" Lets get crontab editing working
if $VIM_CRONTAB == 'true'
set nobackup
set nowritebackup
endif

view raw

gistfile1.vim

hosted with ❤ by GitHub